4QFY2018 Result Update | Cons. Durable
May 16, 2018
Blue Star Ltd
BUY
CMP
`754
Performance Update
Target Price
`867
4QFY18
4QFY17
% chg. (yoy)
3QFY18
% chg. (qoq)
Investment Period
12 Months
Net Sales
1,476
1,369
7.8
981
50.4
Operating profit
90
72
25.6
51
75.7
Stock Info
Sector
Cons. Durable
OPM (%)
6.1
5.2
87bp
5.2
88bp
Market Cap (` cr)
7,546
A dj. PAT
47
37
27.4
18.8
152.1
Net Debt (` cr)
210
Source: Company, Angel Research
Beta
0.2
For 4QFY2018, Blue Star posted results in-line with our expectations both on top
52 Week High / Low
845/587
Avg. Daily Volume
20,316
line and bottom-line fronts. The revenue was higher by 7.8% y-o-y and PAT was
Face Value (`)
2
BSE Sensex
33,812
up 27.4% y-o-y. During the quarter, cooling and the unitary products has been
Nifty
10,442
the key performer for the company. Operating margin improved by 87bps on
Reuters Code
BLUS.BO
Bloomberg Code
BLSTR IN
account of lower material costs.
Blue Start outperformed the industry growth: The company’s top-line grew by
Shareholding Pattern (%)
Promoters
38.9
~7.8% yoy (not adjusted for exercise duty) y-o-y to `1,476cr on the back of
MF / Banks / Indian Fls
24.9
healthy growth in central air conditioning systems. The Central Air Conditioning
FII / NRIs / OCBs
9.4
Indian Public / Others
26.9
Systems segment grew by ~19.3% y-o-y during the quarter (Industry reported
Abs.(%)
3m
1yr
3yr
~15% growth yoy), whereas unitary products segment reported ~9% growth y-o-
Sensex
7.4
27.1
22.9
y. The company has also forayed into other products such as air coolers, water
Blue Star
5.3
13.5
138.4
purifiers and air purifiers which also boosted the company’s growth.
Healthy operating performance aided overall profitability: On the operating front,
the company’s margin improved by 87bps y-o-y on the back of healthy growth in
air conditioning system, which is a higher margin business. On the bottom-line
front, company reported a growth of ~27.4% y-o-y to `47cr on account of
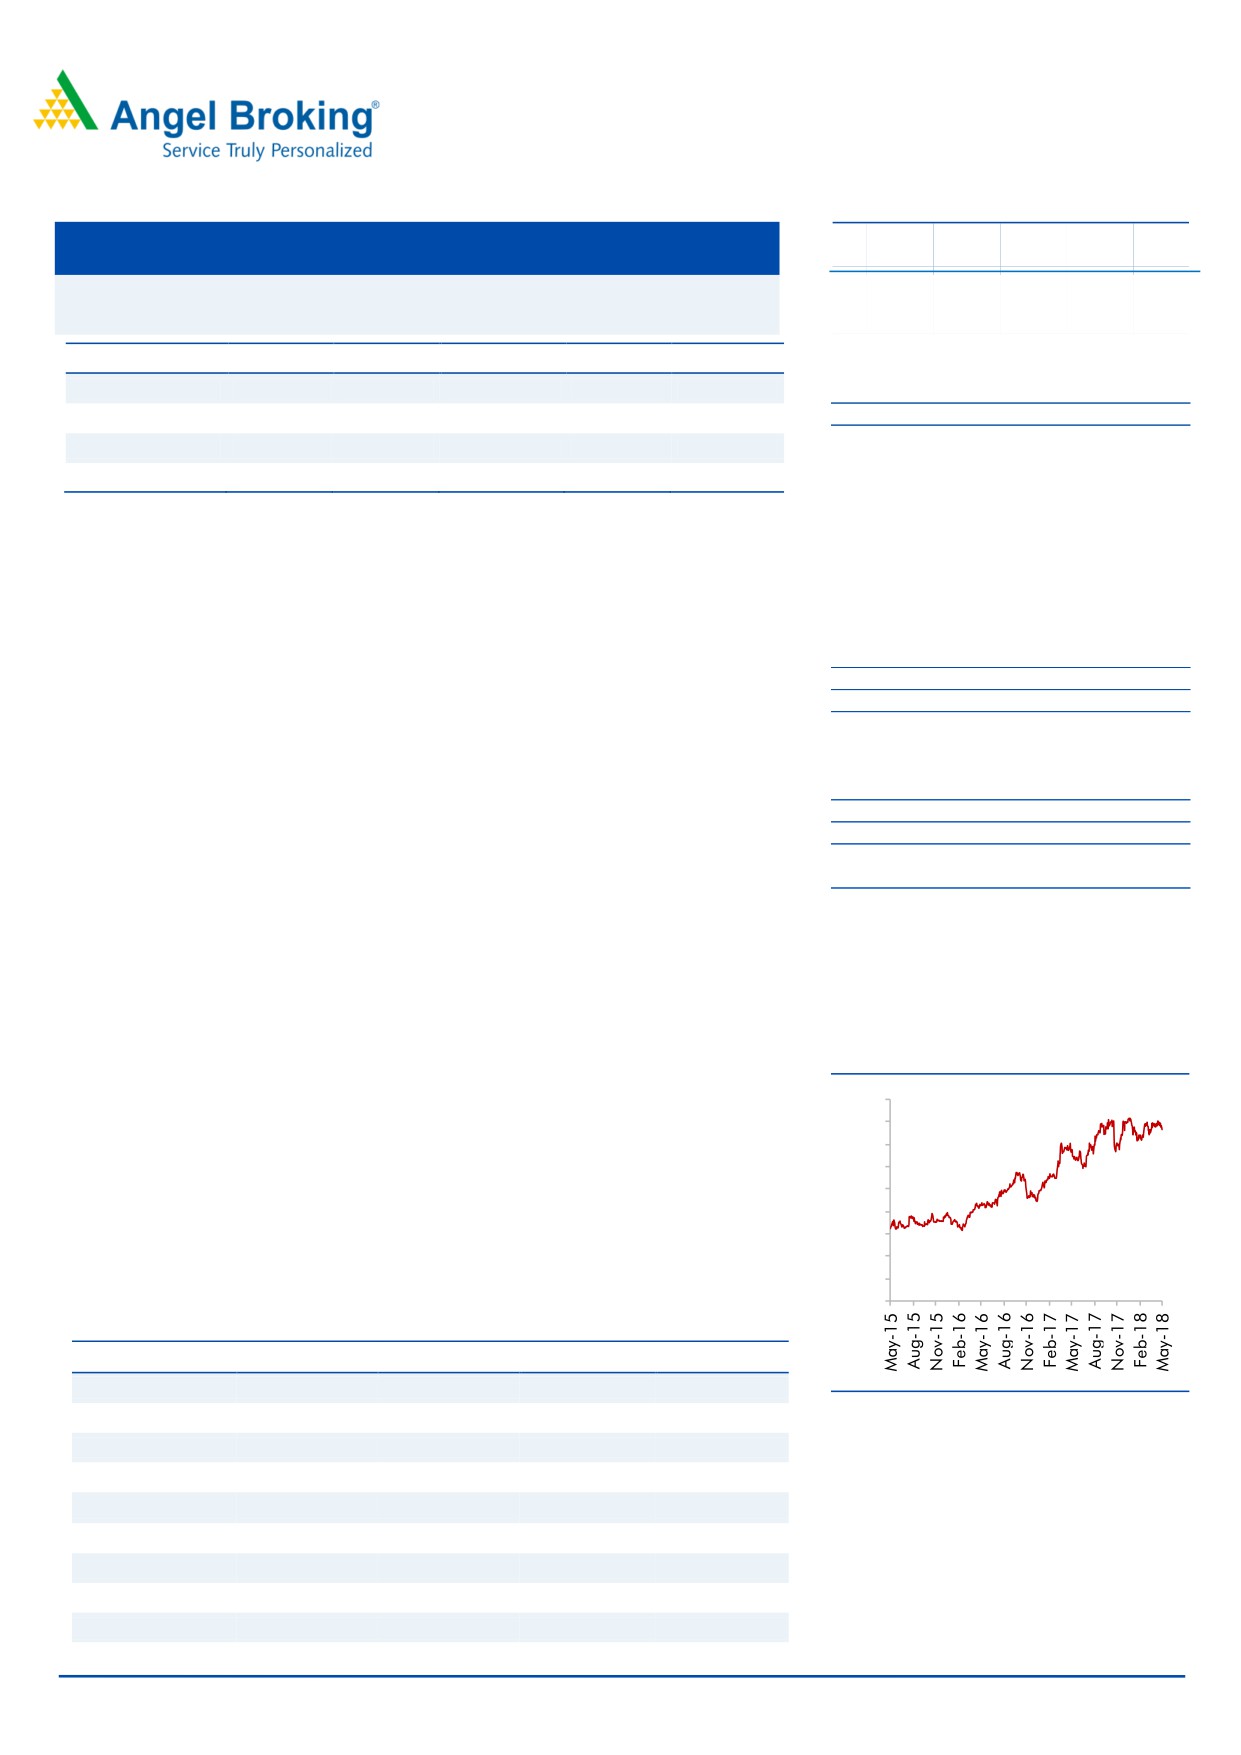
3-year price chart
healthy revenue growth and better operating margins.
900
800
Outlook & Valuation: We forecast Blue Star to report top-line CAGR of ~13% to
700
`6,080cr over FY18-20E on the back of healthy demand growth in Air
600
500
Conditioning and Unitary Products division. On the bottom-line front, we estimate
400
~21% CAGR to `213cr owing to improvement in volumes. We maintain our Buy
300
200
recommendation with a target price of `867.
100
0
Key Financials
Y/E March (`cr)
FY2017
FY2018
FY2019E
FY2020E
Net Sales
4,385
4,741
5,352
6,080
Source: Company, Angel Research
% chg
13.5
8.1
12.9
13.6
Net Profit
123
145
177
213
% chg
12.2
18.1
22.0
20.0
OPM (%)
5.1
5.8
6.0
6.2
EPS (Rs)
12.8
15.1
18.5
22.2
P/E (x)
58.8
49.8
40.8
34.0
Amarjeet S Maurya
P/BV (x)
9.6
8.9
8.2
7.5
022-39357800 Ext: 6831
RoE (%)
16.3
17.8
20.0
21.9
RoCE (%)
16.5
17.9
19.9
22.3
Please refer to important disclosures at the end of this report
1
Blue Star Ltd | 4QFY2018 Result Update
Exhibit 1: 4QFY2018 Performance
Y/E March (`cr)
4QFY18
4QFY17
% chg. (yoy)
3QFY18
% chg. (qoq)
F Y2018
F Y2017
% chg
Net Sales
1,476
1,369
7.8
981
50.4
4,741
4,385
8.1
Net raw material
1025.1
979
4.8
641
59.8
3247.3
3112.25
4.3
(% of Sales)
69.5
71.5
(200)
65.4
409
68.5
71.0
Empl oyee Cost
108
90
19.8
101
6.4
398
339
17.3
(% of Sales)
7.3
6.6
73
10.3
(302)
8.4
7.7
Other Expenses
253
229
10.4
187
35.0
819
712
15.2
(% of Sales)
17.1
16.7
41
19.1
(195)
17.3
16.2
T otal Expe nditure
1,386
1,297
6.8
930
49.0
4,464
4,163
7.2
O perating Profit
90
72
25.6
51
75.7
276
222
24
OPM (%)
6.1
5.2
87
5.2
88
5.83
5.07
76
Interest
11
11
(5.6)
7
45.7
29
38
(23.9)
Depreciation
18
17
10.3
17
6.1
64
61
5.3
Other Income
4
7
(48.9)
4
7.3
22
35
(35.7)
PBT
65
51
26.6
30
114.6
206
159
29.9
(% of Sales)
4.4
3.8
3.1
4.3
3.6
Tax
19
13
39.3
9
99.2
55
37
48.8
(% of PBT)
28.5
25.9
30.7
26.5
23.1
Reported PAT
46
38
22.1
21
121.4
151
122
24.2
PATM
3.1
2.8
2.1
3.2
2.8
Minority Interest
0
0
0
0
0
P/L of Ass. Co.
(1)
(1)
(2)
(2)
1
Extra-ordinary Items
5
4
-
PAT after MI & P/L Asso.Co.
51
37
37.8
19
172.8
145
123
18.1
A dj PAT
47
37
27.4
19
152.1
145
123
18.1
Source: Company, Angel Research
May 16, 2018
2
Blue Star Ltd | 4QFY2018 Result Update
Key investment arguments
Cooling Products division - the backbone for growth: Company is expecting a
+20% (expected to outperform the market 15-20%) growth in FY19 in the cooling
products division. Company is expecting a strong growth in this summer and the
market is expected to further grow driven by the rise in demand.
Newer products and strong demand to aid overall profitability: Blue Star is
planning to add two brand new models to its RAC product range comprising four
models currently in FY19. The company is planning to launch one high wall-
cordless split AC model around the same time. Besides that, increase in demand
from large government related infra projects like metro and some small segments
from hospitals and educational institutions will also help the company to boost
sales.
Wide distribution network: Blue Star has a strong presence in the South and West
and is now planning to increase its presence in North. Hence, company has
already increased their dealer count and is taking steps to improve per dealer
output in Northern region. Moreover, Bluster Silicones, an overseas subsidiary of
China National Bluster (Group) signed a distribution agreement with Grasim
Industries LTD in India over its whole series of silicone products in an attempt to
expand its distribution network in India and increase its market share.
May 16, 2018
3
Blue Star Ltd | 4QFY2018 Result Update
Outlook & Valuation: We forecast Blue Star to report top-line CAGR of ~13%
to `6080cr over FY18-20E on the back of healthy demand growth in air
conditioning and unitary products division. On the bottom-line front, we estimate
~21% CAGR to `213cr owing to improvement in volumes. We maintain our Buy
recommendation with a target price of `867.
Downside risks to our estimates
Any slowdown in consumer segments like IT/ITES, healthcare, hospitality and
infrastructure could impact the company’s growth.
Foreign exchange fluctuations have a direct impact on the profit of the cooling
products division since commercial refrigerators are imported.
The RAC industry has been witnessing high traction and the company has
been able to outperform the industry over the past few years. Any unexpected
drop in performance of the RAC industry would pose a threat to our estimates.
Company Background
Blue Star Limited is an air-conditioning and commercial refrigeration company.
The company conducts various activities, such as electrical, plumbing and fire-
fighting services. Its segments include Electro-Mechanical Projects and Packaged
Air Conditioning Systems, and Unitary Products. The Electro-Mechanical Projects
and Packaged Air-Conditioning Systems segment includes central air-conditioning
projects, electrical contracting business and packaged air-conditioning businesses,
including manufacturing and after sales service. The Unitary Products segment
includes cooling appliances, cold storage products, including manufacturing and
after sales service. The company's products include central air conditioning, room
air conditioners and speciality cooling products. Its other businesses include
marketing and maintenance of imported professional electronic equipment and
services, as well as industrial products and systems, which is handled by Blue Star
Engineering & Electronics.
May 16, 2018
4
Blue Star Ltd | 4QFY2018 Result Update
Consolidated Profit & Loss Statement
Profit & Loss Statement
Y/E March (`cr)
FY2017
FY2018
FY2019E
FY2020E
Total operating income
4,385
4,741
5,352
6,080
% chg
13.5
8.1
12.9
13.6
Total Expenditure
4,163
4,464
5,031
5,703
Raw Material
3,112
3,247
3,645
4,134
Personnel
339
398
460
535
Others Expenses
712
819
926
1,034
EBITDA
222
276
321
377
% chg
39.0
24.2
16.2
17.4
(% of Net Sales)
5.1
5.8
6.0
6.2
Depreciation& Amortisation
61
64
71
78
EBIT
162
213
250
299
% chg
57.2
31.3
17.8
19.4
(% of Net Sales)
3.7
4.5
4.7
4.9
Interest & other Charges
38
29
29
29
Other Income
35
22
20
20
(% of PBT)
21.8
10.8
8.3
6.9
Share in profit of Associ ates
-
-
-
-
Recurring PBT
159
206
242
290
% chg
19.7
29.9
17.2
20.1
Tax
37
55
65
78
(% of PBT)
23.1
26.5
27.0
27.0
PAT (reported)
122
151
176
212
Minority Interest (after tax)
0
0
0
0
Profit/Loss of Associate Company
1
(2)
1
1
Extraordinary Items
-
4
-
-
ADJ. PAT
123
145
177
213
% chg
12.2
18.1
22.0
20.0
(% of Net Sales)
2.8
3.1
3.3
3.5
Basic EPS (Rs)
12.8
15.1
18.5
22.2
Fully Diluted EPS (`)
12.8
15.1
18.5
22.2
% chg
12.2
18.1
22.0
20.0
May 16, 2018
5
Blue Star Ltd | 4QFY2018 Result Update
Consolidated Balance Sheet
Y/E March (`cr)
FY2017
FY2018E
FY2019E
FY2020E
SOURCES OF FUNDS
Equity Share Capital
19
19
19
19
Reserves& Surplus
738
796
867
952
Shareholders Funds
757
815
886
971
Minority Interest
1
1
1
1
Total Loans
221
371
371
371
Deferred Tax Liability
24
24
24
24
Total Liabilities
1,004
1,212
1,283
1,368
APPLICATION OF FUNDS
Gross Block
359
399
439
479
Less: Acc. De preciation
72
135
206
284
Net Block
288
264
233
195
Capital Work-in-Progress
34
34
34
34
Investments
79
79
79
79
Current Assets
2,141
2,472
2,773
3,116
Inventories
596
831
953
1,083
Sundry De btors
939
1,039
1,173
1,333
Cash
97
81
101
111
Loans & Advances
390
402
428
474
Other Assets
120
119
118
116
Current liabilities
1,670
1,769
1,969
2,189
Net Current Assets
471
703
804
927
Deferred Tax Asset
132
132
132
132
Mis. Exp. not written off
-
-
-
-
Total Assets
1,004
1,212
1,282
1,367
May 16, 2018
6
Blue Star Ltd | 4QFY2018 Result Update
Consolidated Cash flow Statement
Y/E March (`cr)
FY2017
FY2018E FY2019E FY2020E
Profit before tax
159
206
242
290
Depreciation
61
64
71
78
Change in Working Capital
(105)
(247)
(81)
(113)
Interest / Dividend (Net)
19
29
29
29
Direct taxes paid
2
(55)
(65)
(78)
Others
(26)
0
0
0
C ash Flow from Operati ons
159
(3)
194
206
(Inc.)/ Dec. i n Fixed Assets
(107)
(40)
(40)
(40)
(Inc.)/ Dec. i n Inve stments
177
0
0
0
C ash Flow from Inve sting
69
(40)
(40)
(40)
Issue of Equity
7
0
0
0
Inc./(Dec.) in loans
6
150
0
0
Dividend Paid (Incl. T ax)
(2)
(87)
(106)
(128)
Interest / Divide nd (Net)
(185)
(7)
(28)
(28)
C ash Flow from Financing
(174)
56
(134)
(156)
Inc./(Dec.) in Cash
54
12
20
10
O pening Cash balance s
15
68
81
101
Closing Cash balances
68
81
101
111
May 16, 2018
7
Blue Star Ltd | 4QFY2018 Result Update
Key Ratios
Y/E March
FY2017
FY2018
FY2019E
FY2020E
Valuati on Ratio (x)
P/E (on FDEPS)
58.8
49.8
40.8
34.0
P/CEPS
39.7
33.6
29.3
25.0
P/BV
9.6
8.9
8.2
7.5
Dividend yield (%)
1.0
1.2
1.5
1.8
EV/Sales
1.7
1.6
1.4
1.2
EV/EBITDA
32.7
27.0
23.1
19.7
EV / Total Assets
7.3
6.1
5.8
5.4
Per Share Data (`)
EPS (Basic)
12.8
15.1
18.5
22.2
EPS (fully diluted)
12.8
15.1
18.5
22.2
Cash EPS
19.0
22.4
25.7
30.2
DPS
7.5
9.1
11.1
13.3
Book Value
78.9
84.9
92.3
101.2
Returns (%)
ROCE
16.5
17.9
19.9
22.3
Angel ROIC (Pre-tax)
20.2
20.7
23.2
26.0
ROE
16.3
17.8
20.0
21.9
Turnover rati os (x)
Asset Turnover (Gross Block)
12.2
11.9
12.2
12.7
Inventory / Sales (days)
50
64
65
65
Receivables (days)
78
80
80
80
Payable s (days)
98
95
93
90
Working capital cycle (ex-cash) (days)
30
49
52
55
Source: Company, Angel Research
May 16, 2018
8
Blue Star Ltd | 4QFY2018 Result Update
Research Team Tel: 022 - 39357800
Website:
DISCLAIMER
This document is solely for the personal information of the recipient, and must not be singularly used as the basis of any
investment decision. Nothing in this document should be construed as investment or financial advice. Each recipient of
this document should make such investigations as they deem necessary to arrive at an independent evaluation of an
investment in the securities of the companies referred to in this document (including the merits and risks involved), and
should consult their own advisors to determine the merits and risks of such an investment.
Angel Broking Pvt. Limited, its affiliates, directors, its proprietary trading and investment businesses may, from time to
time, make investment decisions that are inconsistent with or contradictory to the recommendations expressed herein. The
views contained in this document are those of the analyst, and the company may or may not subscribe to all the views
expressed within.
Reports based on technical and derivative analysis center on studying charts of a stock's price movement, outstanding
positions and trading volume, as opposed to focusing on a company's fundamentals and, as such, may not match with a
report on a company's fundamentals.
The information in this document has been printed on the basis of publicly available information, internal data and other
reliable sources believed to be true, but we do not represent that it is accurate or complete and it should not be relied on
as such, as this document is for general guidance only. Angel Broking Pvt. Limited or any of its affiliates/ group
companies shall not be in any way responsible for any loss or damage that may arise to any person from any inadvertent
error in the information contained in this report. Angel Broking Pvt. Limited has not independently verified all the
information contained within this document. Accordingly, we cannot testify, nor make any representation or warranty,
express or implied, to the accuracy, contents or data contained within this document. While Angel Broking Pvt. Limited
endeavours to update on a reasonable basis the information discussed in this material, there may be regulatory,
compliance, or other reasons that prevent us from doing so.
This document is being supplied to you solely for your information, and its contents, information or data may not be
reproduced, redistributed or passed on, directly or indirectly.
Angel Broking Pvt. Limited and its affiliates may seek to provide or have engaged in providing corporate finance,
investment banking or other advisory services in a merger or specific transaction to the companies referred to in this
report, as on the date of this report or in the past.
Neither Angel Broking Pvt. Limited, nor its directors, employees or affiliates shall be liable for any loss or damage that
may arise from or in connection with the use of this information.
Note: Please refer to the important `Stock Holding Disclosure' report on the Angel website (Research Section). Also,
please refer to the latest update on respective stocks for the disclosure status in respect of those stocks. Angel Broking Pvt.
Limited and its affiliates may have investment positions in the stocks recommended in this report.
Disclosure of Interest Statement Nilkamal
1. Analyst ownership of the stockNo
2. Angel and its Group companies ownership of the stock No
3. Angel and its Group companies' Directors ownership of the stock
No
4. Broking relationship with company covered
No
Note: We have not considered any Exposure below ` 1 lakh for Angel, its Group companies and Directors
Ratings (Returns):
Buy (> 15%)
Accumulate (5% to 15%)
Neutral (-5 to 5%)
Reduce (-5% to -15%)
Sell (< -15%)
May 16, 2018
9